Scott already presented a nice example with the canvas.
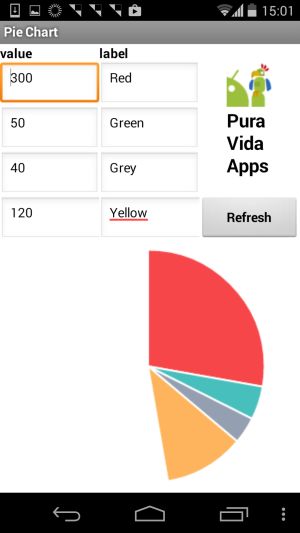
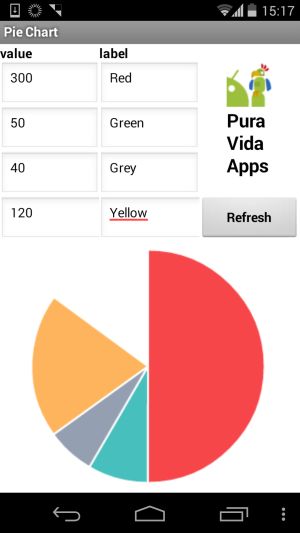
This example here uses some HTML and the Chart.js JavaScript library.
Thank you Nick Downie! As you can see from that page, a Pie chart is only one of several possibilities.
I set up the solution similar to the other HTML examples with input parameters. The solution does not require internet access!
Thank you Jean Maxime for being the sponsor of this tutorial!
The data we are passing to the webviewer must be in JSON format. To check, if it is correct, you can use
http://jsonlint.com.
 The tools extension offers the method PathToAssets which always returns the correct path to the assets.
While opening the webpage, the library provides a nice animation.


<!DOCTYPE html>
<html>
<head>
  <meta name="author" content="puravidaapps.com">
  <meta charset="utf-8">
  <meta-name="viewport" content="width=device-width, initial-scale=1.0, maximum-scale=1.0, user-scalable=no" />

  <title>Pie Chart</title>
  <script src="Chart.min.js"></script>
  <script>
    // urldecode function, which also handles the case of spaces being encoded as +
    // http://stackoverflow.com/a/4458580/1545993
    function urldecode(str) {
      return decodeURIComponent((str+'').replace(/\+/g, '%20'));
    }
  </script>
</head>
<body>
  <div id="canvas-holder">
    <canvas id="chart-area" width="300" height="250"/>
  </div>
  <script>
    window.onload = function(){
      // get the pie data from the url, urldecoded (ONLY FOR TEST PURPOSES)
      //var pieData = urldecode(location.search.slice(1));

      // get the pie data from the window.AppInventor object
      var pieData = window.AppInventor.getWebViewString();

      var ctx = document.getElementById("chart-area").getContext("2d");
      window.myPie = new Chart(ctx).Pie(JSON.parse(pieData));
    };
  </script>
</body>
</html>
Q1: I've tried to make a pie chart on ai2 with taifun tools, but the pie chart didn't come out on the application (it was blank)?
A: which most probably means, you forgot to upload the pie.html and Chart.min.js library into the assets of your project... check the example project ...
Q2: I've seen your tutorial about pie chart. Im wondering how I could use that to create a line graph.
A: Please see Juan Antonio's examples here.

Developing and maintaining snippets, tutorials and extensions for App Inventor takes a lot of time.
I hope it saved some of your time. If yes, then you might consider to donate a small amount!
or donate some mBTC to  Address:
1Jd8kXLHu2Vkuhi15TWHiQm4uE9AGPYxi8

Thank you! Taifun
Download aia file for App Inventor 2
Back to top of page ...

This work by Pura Vida Apps
is licensed under a Creative Commons Attribution-ShareAlike 3.0 Unported License
with attribution (name=Pura Vida Apps and link to the source site) required.